Tracking your reservation statistics is crucial to determining how well your store has performed over a given period in terms of table bookings. GonnaOrder allows you to view reservation statistics on the Statistics menu in your admin dashboard. Whether you want to view daily or monthly reservation statistics, GonnaOrder has got you covered. The insights from these statistics can help you identify areas of improvement and incorporate measures to maximize reservations made over time.
On This Page
Select Reservation Statistics Timeframe
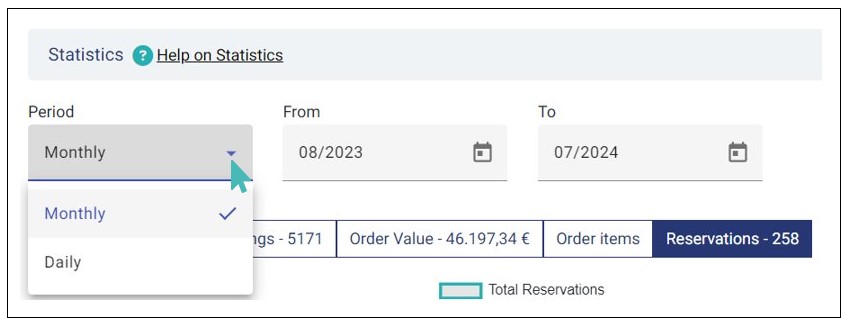
GonnaOrder allows you to select a timeframe within which you want to view your reservation statistics. This can be in days or months depending on your needs. If you choose your preferred timeframe or period to be Daily, you can view statistics of up to 30 days. On the other hand, you can view statistics of up to twelve months if you choose the Monthly period option.
Whether you choose to view daily or monthly statistics, you can filter them by date range by selecting the From (start date) and To (end date). This ensures that you only see reservation statistics of the desired timeframe.
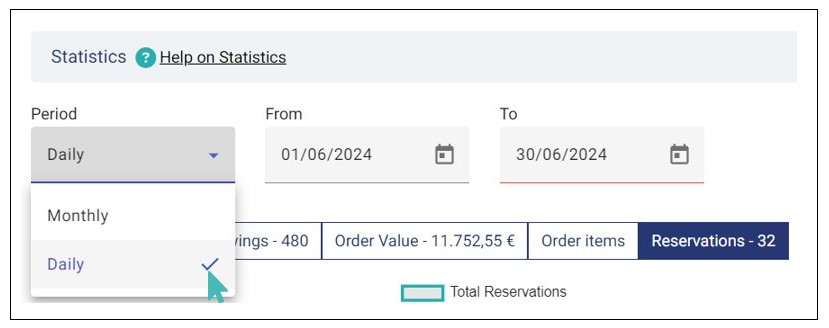
To select reservation statistics timeframe, go to Statistics on the left menu of your store’s dashboard and choose the desired period, From (start date), and To (end date).
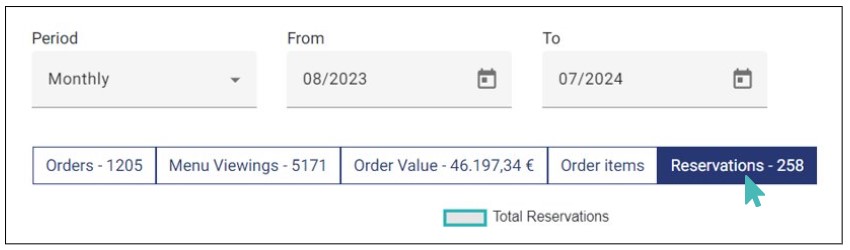
Next, click the Reservation tab to view reservation statistics of the period you just selected.
Monthly Reservation Statistics
As initially stated, you can visualize your monthly reservation statistics of up to 12 months. With these statistics, you can compare the reservation trend over a long period of time.
With GonnaOrder, you can visualize your table reservation statistics in two ways:
Graphical presentation
Tabular statistics
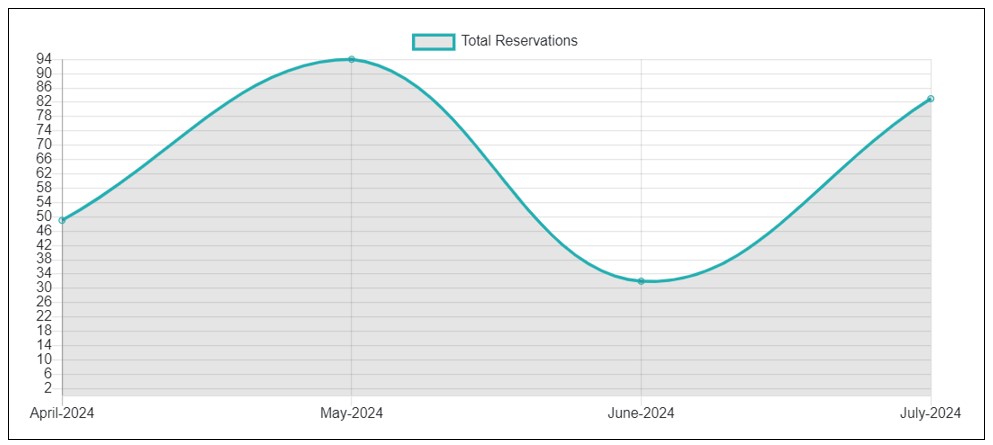
For the graphical option, the graph is plotted with number of reservations on the Y-axis and month on the X-axis. This presentation enables you to quickly visualize the table reservation trend over the months within the selected period.
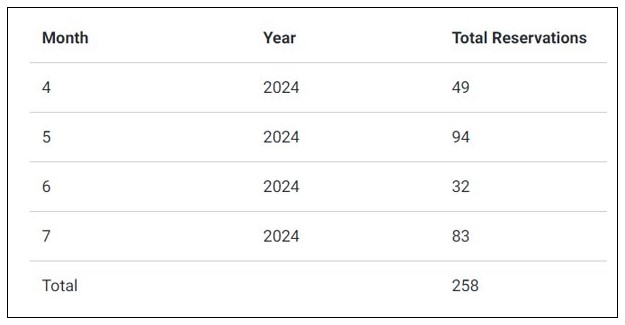
On the other hand, the tabular statistics gives you the figures directly for easy comparison and calculation. The table shows the month, year, and the respective number of reservations for each month. Also, it displays the total number of reservations over the entire period.
Daily Reservation Statistics
At times, you may want to view or compare the reservation statistics over a short period of time, say days or a few weeks. And that’s where daily reservation statistics come in. With this option, you can visualize the reservation statistics per day for a period of up to 30 days.
Simply select the Daily option on the Period dropdown and choose the start and end date. This will generate both a graphical and tabular presentation of the reservation statistics within that period.
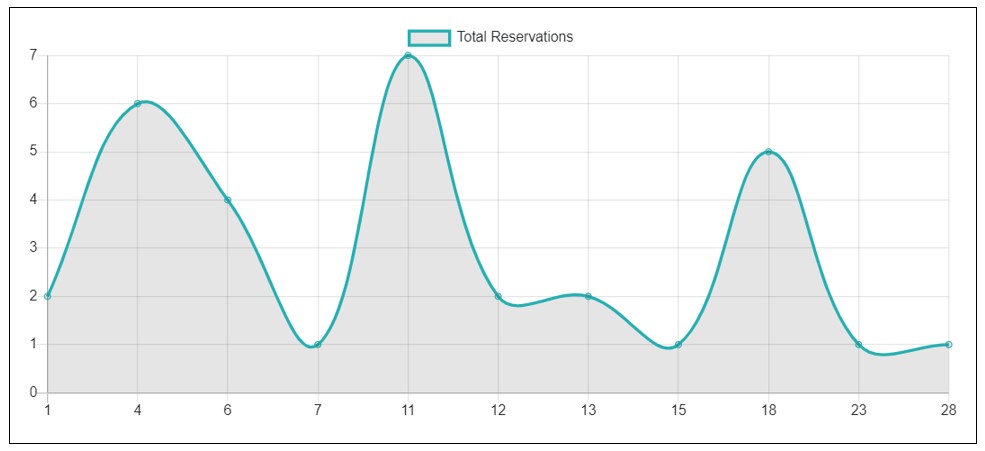
The graph shows the number of reservations (on Y-axis) against the date (on the X-axis). This enables you to have a quick overview of the daily reservation trend at a glance.
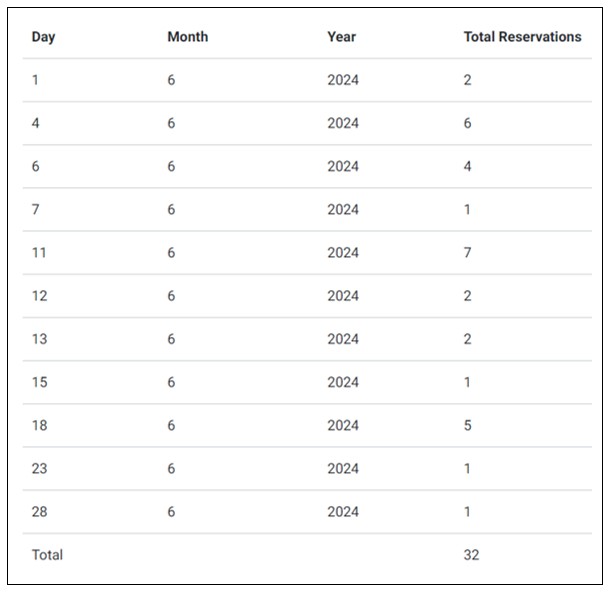
For the tabular statistics, you can see the day, month, and year along with the respective number of reservations. Also, you can view the total number reservations over the selected timeframe.
Note
The days or months with zero (0) reservations are not plotted on the graph or listed on the table.